Thursday, 16 December 2021

what is a good PhD contribution?

When PhD candidates embark on their thesis journey, the first thing they will likely learn is that their research must be a “significant original contribution to knowledge.” 

A PhD should make an original contribution to knowledge. Originality can be achieved through the study design, the nature or outcomes of the knowledge synthesis, or the implications for research and/or practice.

Source: https://www.universityaffairs.ca/career-advice/career-advice-article/how-to-make-an-original-contribution-to-knowledge/

The first step for PhD students is to recognize that a thesis will be built on other people’s work in a rigorous, precise way and is not expected to lead to an immediate and fundamental paradigm shift in the field.

The significant original contribution emerges from small gaps within saturated research areas as novel interpretations or applications of old ideas. The researcher can accomplish this in many ways, for example, by creating a synthesis, by providing a single original technique, or by testing existing knowledge in an original manner. Although the thesis has to be innovative, this doesn’t necessarily mean revolutionizing the existing discourse; there is also value in adding new perspectives.

Having a well-bounded and clear idea of one’s contribution contextualizes the work and can protect the student from undue criticism.

This is always an iterative process, starting with a literature review and later comparing results against the significance of other works.


Thursday, 4 November 2021

How to write a good paper summary

 Reading a Computer Science Research Paper

Page 4 on this link

https://pages.cpsc.ucalgary.ca/~pwlfong/Pub/inroads2009.pdf

Monday, 29 June 2020

EMSE paper FACER end to end code execution instructions

Physical path: F:/FACER_2020/Code

GitHub repo name where code is committed: FACER_2020

Please check https://github.com/shamsa-abid/FACER_Artifacts too

In F:/FACER_2020/Code/FACER/src/support/Constants.java

public static String PROJECTS_ROOT = "F:/FACER_2020/RawSourceCodeDataset/ClonedNew";
public static String DATABASE = "jdbc:mysql://localhost/faceremserepopoint5?useSSL=false&user=root";
public static String LUCENE_INDEX_DIR = "F:/FACER_2020/LuceneData/faceremserepo";

but now we get these settings from the command line as arguments. This is coded in the FACER repo Building Code file:
F:\FACER_2020\Code\FACER\src\sourcerer_parser_stmts\ParseContextAction.java

Two new csv files will be created in an output folder

Running FACER Clustering and MCS detection

execute Rscript using the csv files to get the csv file containing cluster IDs

F:\FACER_2020\Code\R\Nick1.R has the latest code but you will have to uncomment or modify csv fie names input and output.
Execute
F:\FACER_2020\Code\FASeR_Recommender\src\_0_AlphaCalculator\MCSMining.java

Your repo is ready


For Evaluation:

F:\FACER_2020\Code\FASeR_Recommender\src\automated_evaluation\Evaluation.java


Tuesday, 11 February 2020

sql query for no of patterns for a support threshold

SELECT distinct(support),count(support) as number_of_patterns FROM `feature_support` 
group by support

Thursday, 6 February 2020

Evaluate Stage 1 of FACER

Use Eclipse workspace FOCUS2

Use F:\PhD\4thYear\FOCUS\FOCUS_Evaluation\src\focus\dataset\create\FOCUSDataFileCreation.java
to create a set of files for each project in FOCUS readable format
Make sure to set the repo in constants file and the name of folder to save the files in.

FOCUS needs a List txt file to keep in the dataset folder. You need to create the list file using this command:
dir /b > List.txt

Open it and remove List.txt from it
This is your FOCUS evaluation dataset
F:\PhD\4thYear\FOCUS\FOCUS_Evaluation\101reponew

Now you need copy a template evaluation folder from F:\PhD\4thYear\FOCUS-ICSE19-artifact-evaluation\evaluation    and put it in the dataset folder

Then I used F:\PhD\4thYear\FOCUS-ICSE19-artifact-evaluation\crossminer-FOCUS-4c02746\tools\Focus\evaluation.properties file to set the configuration especially the location of dataset is set to
sourceDirectory=F:/PhD/4thYear/FOCUS/FOCUS_Evaluation/101reponew/

Then I ran F:\PhD\4thYear\FOCUS-ICSE19-artifact-evaluation\crossminer-FOCUS-4c02746\tools\Focus\src\main\java\org\focus\Runner.java

This gives FOCUS results on our dataset. Save them in a text file. Also FOCUS creates the evaluation folder which is to be used by FACER in its evaluation. For configuration C1.1 , save the evaluation folder and output results of FOCUS in a folder
F:\PhD\4thYear\FOCUS\FOCUS_Evaluation\101reponewC1.1tenfold etc.

I changed the ns values to get results for top 10 recommendations only

Now we have to evaluate the dataset with FACER using FACER F:\PhD\4thYear\FOCUS\FACERQueryBuilder\src\automated_evaluation_focus\MainRunner.java
static String evaluationFolderPath = "F:\\PhD\\4thYear\\FOCUS\\FOCUS_Evaluation\\101reponewC1.1tenfold\\evaluation";

static File destFolder2 = new File("F:/101reponew/10fold/C1.1/Q2");
The results get copied to destination folder as a backup

support.Constants.DATABASE = "jdbc:mysql://localhost/101reponew?useSSL=false&user=root";

also set the following
File srcFolder = new File( "F:\\PhD\\4thYear\\FOCUS\\FOCUS_Evaluation\\101reponewC1.1tenfold\\evaluation");

After the FACER generates recommendations, use FOCUS to get metrics for the generated folder. Give the path of evaluation folder in properties file and comment out the part where FOCUS generates its results. Instead, it will now only traverse the folders to output metrics values. I copied the results directly to excel.


FACER end to end execution

The following is outdated please check new post with new steps:

For EMSE paper I am using the following:

101 repo new with corrected code for search indices for comments and API names, using eclipse JDT parser

public static String PROJECTS_ROOT = "E://101projects";
public static String DATABASE = "jdbc:mysql://localhost/101reponew?useSSL=false&user=root";
public static String LUCENE_INDEX_DIR = "F:/temp/101reponew";

FACER repo Building Code:
F:\PhD\PhD Defense\FACERGitRepository\FACER\src\replicateparser\ParseContextAction.java

Now you have to manually add api_call_index_id column in api_call table

Then execute code to populate the column using F:\PhD\PhD Defense\Code\MyUPMiner\src\_1_api_call_index\APICallIndexing.java

Then you have to populate sequence table using  F:\PhD\PhD Defense\Code\MyUPMiner\src\_2_SeqSim\PairwiseSequenceScoring.java

Then you have to generate a CSV for clustering the sequences using

select host_method_id as methodID,api_call_index_id as APICall from api_call
where api_call_index_id!=0

Export it to a CSV and put it on Codec, use putty to execute Nicks.R script.
Command is Rscript Nicks.R
Make sure that the input and output csv file names in Nicks.R are set to the ones you need

Populate the clusters table and Execute the code F:\PhD\PhD Defense\Code\MyUPMiner\src\_3_i_WriteClustersFromR\WriteClusters.java

Make sure to set the correct database url for the constants file.

Create transaction table using F:\PhD\PhD Defense\Code\FASeR_Recommender\src\_1_TransactionTable\TransactionTable.java

Make sure to set the correct database url for the constants file.
Save the file as TransactionTablefor101reponew.txt and Input it to spmf FPClose algo to get the frequent patterns and save it as a text file 101reponew.txt

Mine frequent patterns using F:\PhD\PhD Defense\Code\spmf\ca\pfv\spmf\test\MainTestFPClose_saveToFile.java
make sure to change the input (101reponew.txt) output files (output_101reponew_point03.txt)

Copy the output file to FASER Recommender folder
Populate related features using F:\PhD\PhD Defense\Code\FASeR_Recommender\src\_3_PopulateRelatedFeatures\PopulateRelatedFeatures.java
make sure to change the input file name to the one you mined i.e. output_101reponew_point03.txt


Monday, 27 January 2020

Friday, 17 January 2020

sql query to find non-singleton clone groups

select CID,size from
(SELECT distinct(clusterID) as CID, count(clusterID) as size FROM `cluster`
group by clusterID) as t
where size>1


Monday, 6 January 2020

Switch columns to rows in Excel

The solution is to use the TRANSPOSE function

Follow instructions here:
https://support.office.com/en-us/article/transpose-function-ed039415-ed8a-4a81-93e9-4b6dfac76027

Step 1: Select blank cells

First select some blank cells. But make sure to select the same number of cells as the original set of cells, but in the other direction. For example, there are 8 cells here that are arranged vertically:
Cells in A1:B4
So, we need to select eight horizontal cells, like this:
Cells A6:D7 selected

This is where the new, transposed cells will end up.

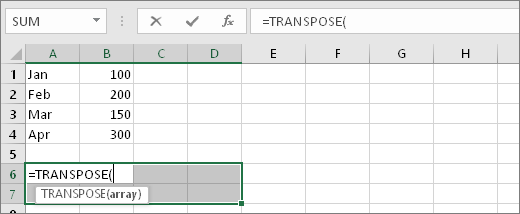
Step 2: Type =TRANSPOSE(

With those blank cells still selected, type: =TRANSPOSE(
Excel will look similar to this:

=TRANSPOSE(
Notice that the eight cells are still selected even though we have started typing a formula.

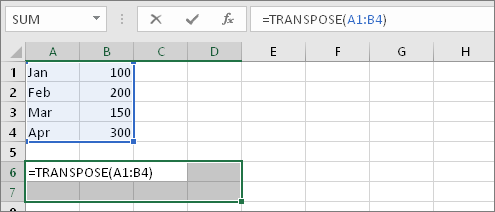
Step 3: Type the range of the original cells.

Now type the range of the cells you want to transpose. In this example, we want to transpose cells from A1 to B4. So the formula for this example would be: =TRANSPOSE(A1:B4) -- but don't press ENTER yet! Just stop typing, and go to the next step.
Excel will look similar to this:
=TRANSPOSE(A1:B4)

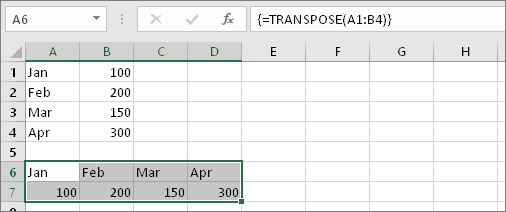
Step 4: Finally, press CTRL+SHIFT+ENTER

Now press CTRL+SHIFT+ENTER. Why? Because the TRANSPOSE function is only used in array formulas, and that's how you finish an array formula. An array formula, in short, is a formula that gets applied to more than one cell. Because you selected more than one cell in step 1 (you did, didn't you?), the formula will get applied to more than one cell. Here's the result after pressing CTRL+SHIFT+ENTER:
Result of formula with cells A1:B4 transposed into cells A6:D7

Wednesday, 1 January 2020

Code for making color pack visualization in R using custom dataset

library(ggraph)
library(igraph)
library(dplyr)


df <- data.frame(group=c("root", "root", "a","a","b","b","b"), 
                 subitem=c("a", "b", "x","y","z","u","v"),
                 size=c(0, 0, 6,2,3,2,5))

# create a dataframe with the vertices' attributes

vertices <- df %>%
  distinct(subitem, size) %>%
  add_row(subitem = "root", size = 0)

graph <- graph_from_data_frame(df, vertices = vertices)

ggraph(graph, layout = "circlepack", weight = size) +
  geom_node_circle(aes(fill =depth)) +
  # adding geom_text to see which circle is which node
  geom_text(aes(x = x, y = y, label = paste(name, "size=", size))) +
  coord_fixed()

Code for making a color pack visualization in R using flare dataset

library(ggraph)
library(igraph)
library(tidyverse)
# We need a data frame giving a hierarchical structure. Let's consider the flare dataset:
edges <- flare$edges

# Usually we associate another dataset that give information about each node of the dataset:
vertices <- flare$vertices

# Then we have to make a 'graph' object using the igraph library:
mygraph <- graph_from_data_frame( edges, vertices = vertices )

# Make the plot
ggraph(mygraph, layout = 'circlepack') +
  geom_node_circle() +
  theme_void()

ggraph(mygraph, 'treemap', weight = size) +
  geom_node_tile(aes(fill = depth), size = 0.25) +
  theme_void() +
  theme(legend.position="none")


Friday, 29 November 2019

Making an academic website using Academic

https://sourcethemes.com/academic/

The above link is the home page for the website that allows the creation of an academic website with the help of a template.

Installation requirements are git, hugo and hugo-extended and visual studio code for code editing.

Install with git using the instructions on this link: https://sourcethemes.com/academic/docs/install/#install-with-git
Then to customize the template, follow the instructions on the following link:
https://sourcethemes.com/academic/docs/get-started/#introduce-yourself

Change the menu as desired in the menus.toml file. Hide the widgets you don't need to be shown by setting the active variable in a page's code to false. Instead of the default avatar.jpg, put your own image and rename it to avatar.jpg. You can also add publication pages for each of your publication using the instructions here: https://sourcethemes.com/academic/docs/managing-content/#manually

Test the web site by running hugo server command and check http://localhost:1313/ in the browser. Deploy the website on GitHub by following these instructions:
https://sourcethemes.com/academic/docs/deployment/#github-pages
Once deployed, you can make future changes to your website and execute the following commands:
git add . git commit -m "Initial commit" git push -u origin master
hugo cd public git add . git commit -m "Build website" git push origin master cd ..


Here is mine :  https://shamsa-abid.github.io/

Thursday, 7 November 2019

Excel Macro Code to change x axis maximum scale of chart

Sub setXAxisMaximumScale()
 ActiveSheet.ChartObjects("Chart 2").Activate
    ActiveChart.Axes(xlCategory).Select
    ActiveChart.Axes(xlCategory).MaximumScale = 1
End Sub


P.s. I first recorded a macro and viewed its code to get this

Sunday, 3 November 2019

Creating boxplot in R

To create a boxplot pr box and whisker chart in R studio, we can use Excel csv file as the source of input data. We need two columns in the csv. In my case column1 contains precision and column2 contains the approach type.

The R code is as follows:
x <- read.csv("boxplotR2.csv",header=T, sep=",")
print (head(x))
boxplot(precision ~ approach, data = x, ylab = "Precision",
        xlab = "Related Function Recommendation Strategies")

and I get the boxplot

Thursday, 24 October 2019

p-value and t-test statistical significance

To calculate the statistical significance, we use the t-test tool in Excel. It is available as part of the Data Analysis Add-Inn. You need to go to the Data tab and click the Analysis button. If the Analysis option does not show, you need to go to Excel Options in the Home menu and enable the Data Analysis add-in.

The following is taken from the Excel Help.

I need to compare the precision values reported for retrieved functions for two different strategies. The retrieved functions

t-Test: Two-Sample Assuming Unequal Variances
This analysis tool performs a two-sample student's t-Test. This t-Test form assumes that the two data sets came from distributions with unequal variances. It is referred to as a heteroscedastic t-Test. As with the preceding Equal Variances case, you can use this t-Test to determine whether the two samples are likely to have come from distributions with equal population means. Use this test when there are distinct subjects in the two samples.


references:

https://wallstreetmojo.com/p-value-in-excel/

Tuesday, 22 October 2019

How to display images in Latex side by side

I got the solution from https://tex.stackexchange.com/questions/186615/how-can-i-arrange-multiple-figures-in-rows-of-3-in-a-two-column-document?rq=1


\usepackage{lipsum,graphicx,multicol}
\begin{document}
%\abovecaptionskip=0pt
\begin{figure*}[t]
\begin{multicols}{3}
    \includegraphics[width=\linewidth]{example-image-a}\par\caption{caption}
    \includegraphics[width=\linewidth]{example-image-b}\par\caption{caption}
    \includegraphics[width=\linewidth]{example-image-c}\par\caption{caption}
\end{multicols}
\begin{multicols}{3}
    \includegraphics[width=\linewidth]{example-image-a}\par\caption{caption}
    \includegraphics[width=\linewidth]{example-image-b}\par\caption{caption}
    \includegraphics[width=\linewidth]{example-image-c}\par\caption{caption}
\end{multicols}
\end{figure*}
\lipsum[1-10]

Friday, 18 October 2019

Undefined control sequence error and can not find file error in includegraphics latex command

The solution was to update Miktex after installing it

I had issues with fixing a broken miktex installation

The proper way to install miktex is to Run As Administrator and Install for all users! And when the installation completes then immediately update MikTex.

Monday, 7 October 2019

Editing the marker size of charts in excel using VB code based macro

Sub sizechangemarker()
Dim Count As Integer
For Count = 1 To 5
Worksheets(8).ChartObjects(4).Chart _
 .SeriesCollection(Count).MarkerSize = 4
Next Count
End Sub

There were 5 lines on the fourth chart in the eighth worksheet. The for loops repeats the marker size setting for each series or line.


what is a good PhD contribution?

When PhD candidates embark on their thesis journey, the first thing they will likely learn is that their research must be a “significant ori...